
8/21/2016 Webmaster
Using Application Insights With Microsoft Bot Framework
With Application Insights, you can Insert a few lines of code in your Bot to find out what your users are doing.
When you install Application Insights, you are installing a small instrumentation package in your application, then, you set up an Application Insights resource in the Microsoft Azure portal.
The instrumentation you install, monitors your app and sends telemetry data to the Microsoft Azure portal. The Microsoft Azure portal shows statistical charts and has powerful search tools to help you monitor your application and diagnose any problems.
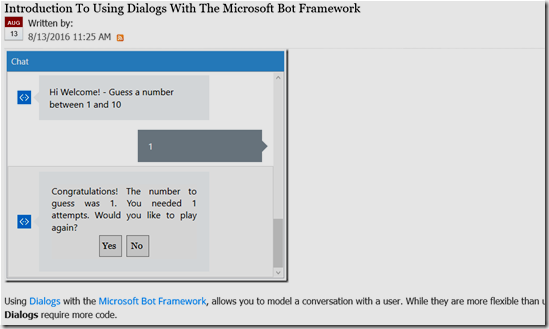
To demonstrate this, we will start with the Bot created in the article: Introduction To Using Dialogs With The Microsoft Bot Framework.
This will require using Microsoft Azure. If you do not have a Microsoft Azure account, go to https://azure.microsoft.com and create an account and a subscription.
Enable Application Insights
Open the AiNumberGuesserBot project (that you can download from: Introduction To Using Dialogs With The Microsoft Bot Framework) and open in Visual Studio 2015.
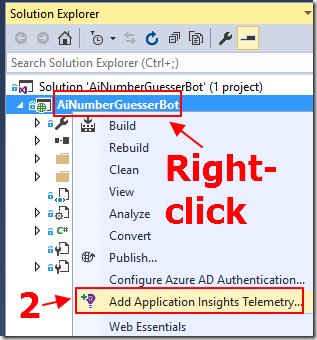
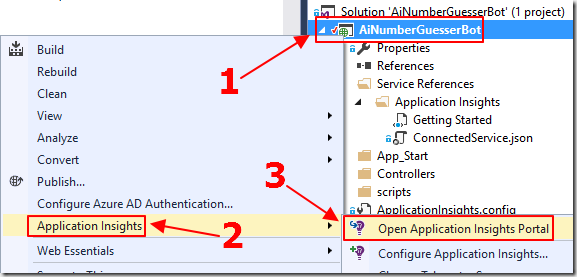
In the Solution Explorer in Visual Studio, right-click on the Project (not the Solution), and select Add Application Insights Telemetry.
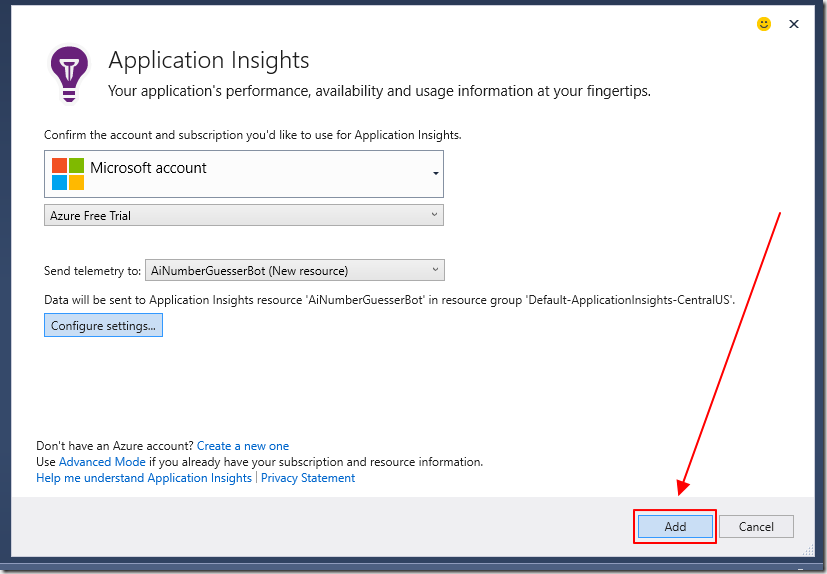
You will first be required to log into your Microsoft Azure Account.
After doing so, you will be presented with a form to create (by choosing the (New resource) option in the Send telemetry to dropdown) or connect to an exiting Application Insights resource (by selecting it in the Send telemetry to dropdown).
After selecting the configuration options, click the Add button to proceed.
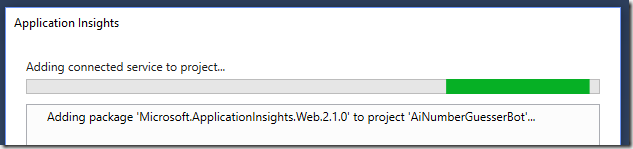
Application Insights assemblies will be added to the project.
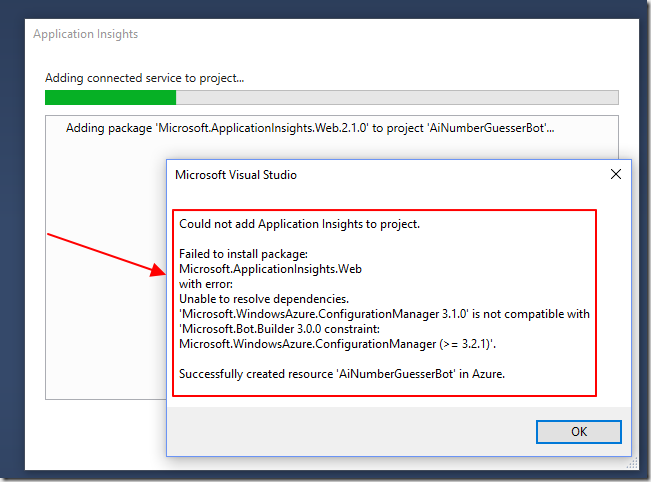
If you get an error, most likely you have components that need to be updated.
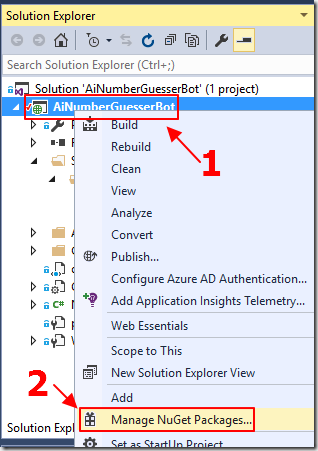
In the Solution Explorer in Visual Studio, right-click on the Project (not the Solution), and select Manage NuGet Packages.
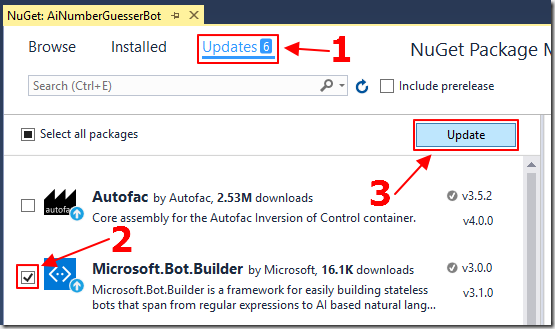
Select Updates, select the components that the error message indicates need to be updated, and click the Update button.
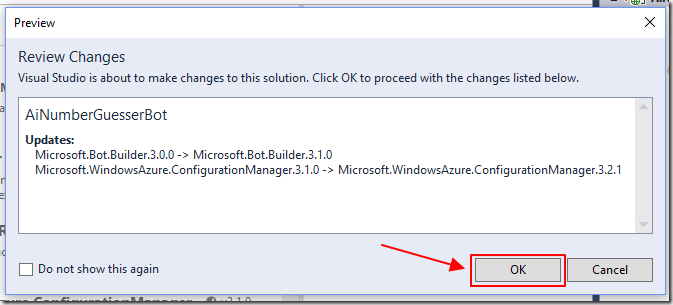
When the Review Changes box shows, click the OK button.
Next, right-click on the Project and select Add Application Insights Telemetry again to re-start the process.
The Application Insights components should now install successfully.
Debug The Application
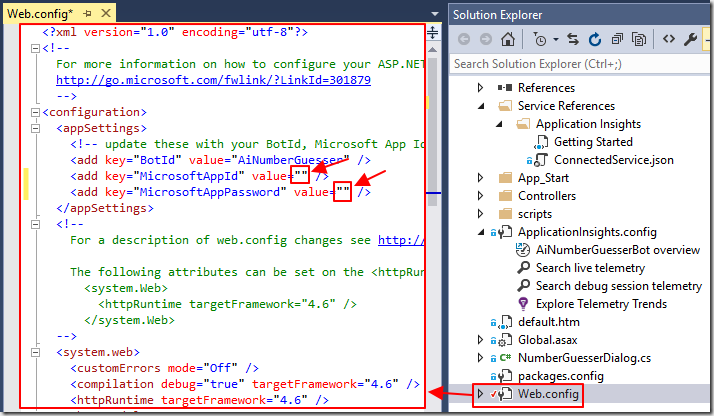
Before you try to debug, clear any MicrosoftAppId and MicrosoftAppPassword settings that there may be in the Web.config file and then save the file.
This is required so that you can easily debug locally.
Remember to replace any settings if you need to publish the application again.
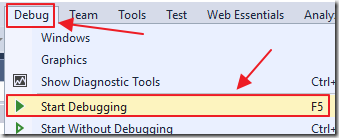
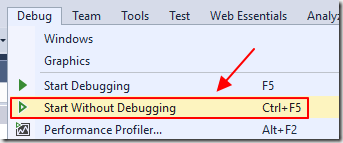
Hit F5 to run the project.
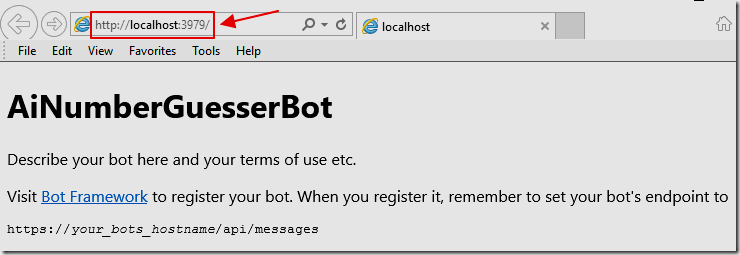
The application will open in the web browser.
Note the web address, you will need it in the next step.
Using The Bot Emulator
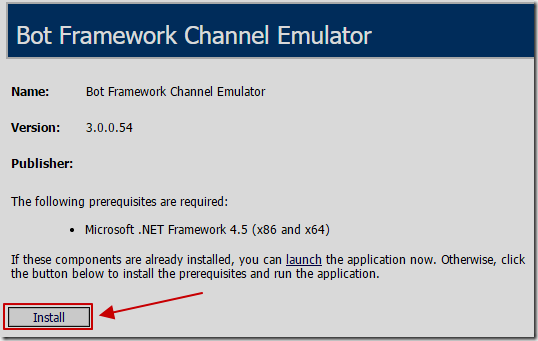
Download, install, and run the Bot Framework Emulator (Windows) (also see: Mac and Linux support using command line emulator if you don’t have Windows).
When the emulator starts, connect to the Bot by setting the address to the the one indicted in the web browser (however, add /api/messages to the end).
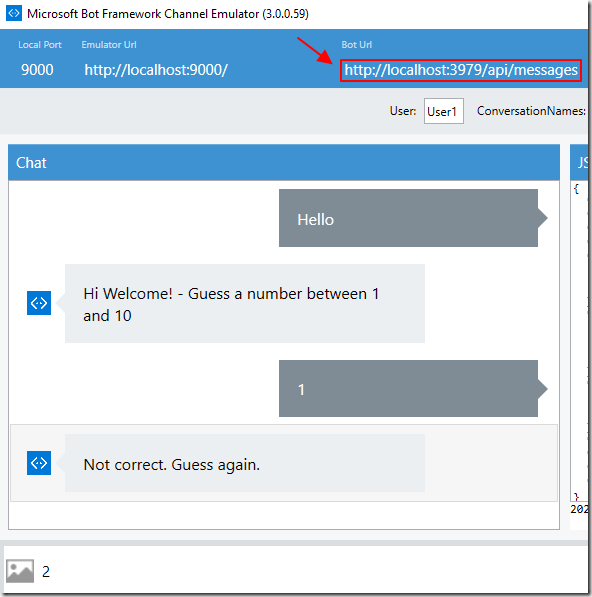
In the Bot Emulator, enter Hello in the text box and click the send key (or press enter).
You will see the response in the Chat window and the JSON contents of the response in the JSON window.
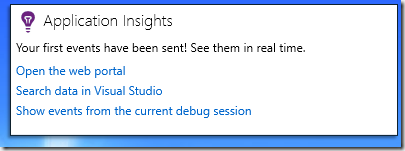
You should see a window pop up that provides links to the telemetry data.
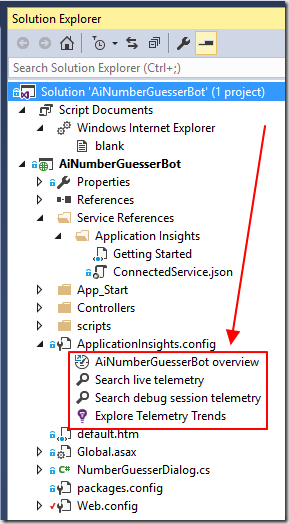
You can also access the data by clicking on the links in the ApplicationInsight.config section in the Solution Explorer of Visual Studio while he application is running.
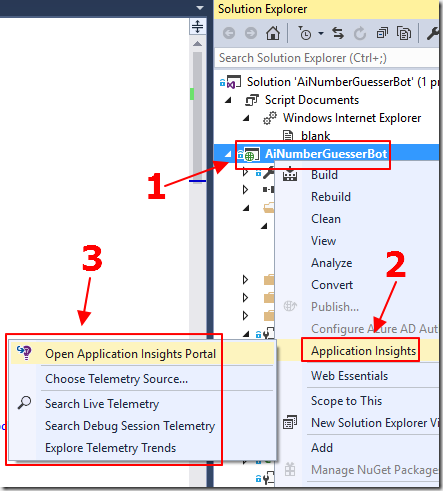
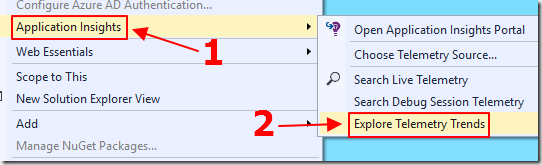
Also, you can right-click on the Project and select Application Insights to show the menu that will provide all the options.
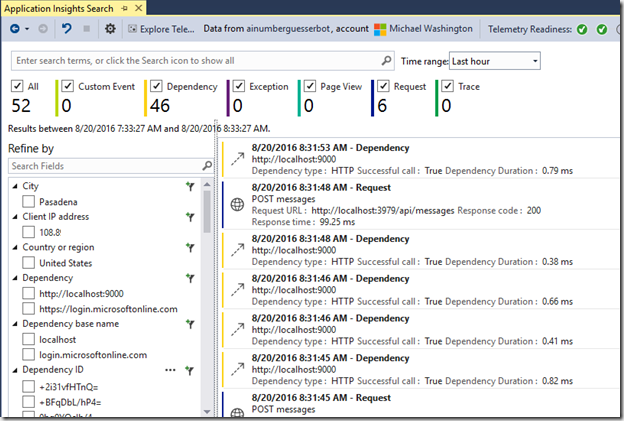
Selecting Search Live Telemetry or Search Debug Session Telemetry will open a window in Visual Studio that will display telemetry data.
See: Learn more about Application Insights tools in Visual Studio for more information on using these windows.
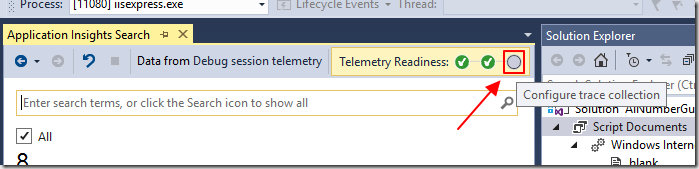
For full Telemetry Readiness, ensure all the green dots are checked. if any aren’t click on them.
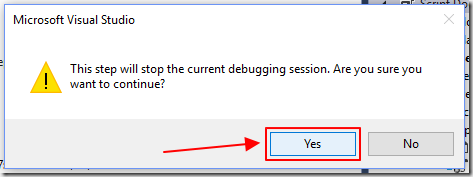
It will stop debugging to add components.
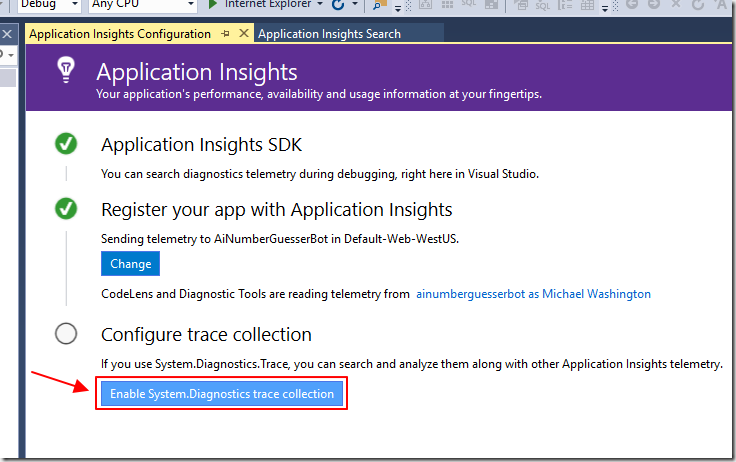
You will be able to click a button to add or configure the components.
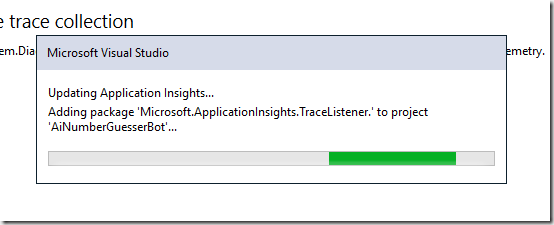
The components will be added.
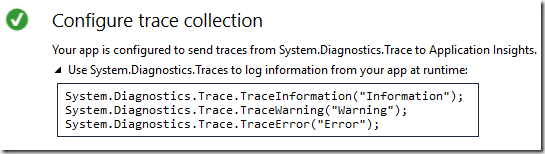
The result will be displayed.
Custom Telemetry
On of the most powerful features of Application Insights, is using it to track your own custom telemetry.
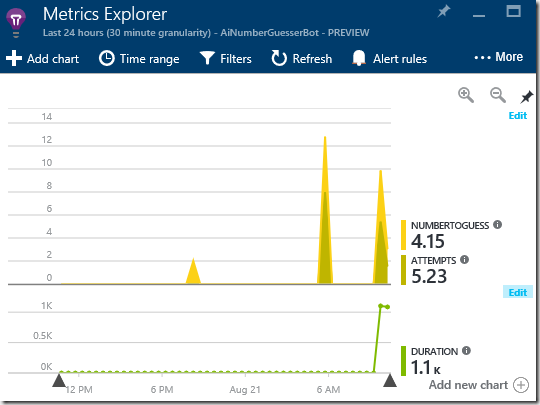
We will now demonstrate using it to track when a game is started, completed, what number a user needed to guess, and how many attempts they required.
In the AiNumberGuesserBot project, open the NumberGuesserDialog.cs file and add the following using statements:
using Microsoft.ApplicationInsights;
using System.Collections.Generic;
Next, add the following line to the class:
        // TelemetryClient is not Serializable but is in a class
        // marked [Serializable] so it must be marked as [NonSerialized]
        [NonSerialized()]
        private TelemetryClient telemetry = new TelemetryClient();
Finally add the following lines to the StartAsync method:
            // Set up some properties and metrics:
            // Properties - String values that you can use to filter
            // your telemetry in the usage reports.
            // Metrics - Numeric values that can be presented graphically
            var properties = new Dictionary<string, string>
            { {"Method", "StartAsync"}};
            var metrics = new Dictionary<string, double>
            { {"NumberToGuess", this.intNumberToGuess}};
            // Send the event:
            telemetry.TrackEvent("GameStarted", properties, metrics);
This will track a game being started and the number the user needs to guess.
Also add the following code to track the game completed:
                    // Because telemetry client is not serialized we have to
                    // instantiate it each time we use it
                    telemetry = new TelemetryClient();
                    var properties = new Dictionary<string, string>
                    { {"Method", "MessageReceivedAsync"}};
                    var metrics = new Dictionary<string, double>
                    {
                        { "NumberToGuess", this.intNumberToGuess},
                        { "Attempts", this.intAttempts}
                    };
                    // Send the event:
                    telemetry.TrackEvent("GameCompleted", properties, metrics);
There are a number of API calls we can use to track custom events as the following table illustrates:
Application Insights API summary
From: https://azure.microsoft.com/en-us/documentation/articles/app-insights-api-custom-events-metrics/
Method Used for TrackPageView Pages, screens, blades or forms TrackEvent User actions and other events. Used to track user behavior or to monitor performance. TrackMetric
Performance measurements such as queue lengths not related to specific events TrackException Log exceptions for diagnosis. Trace where they occur in relation to other events and examine stack traces. TrackRequest Log the frequency and duration of server requests for performance analysis. TrackTrace Diagnostic log messages. You can also capture 3rd-party logs. TrackDependency Log the duration and frequency of calls to external components on which your app depends.You can attach properties and metrics to most of these telemetry calls.
Run the application and enter some sample data.
When you select the Application Insights menu in Visual Studio, and then select Explore Telemetry Trends…
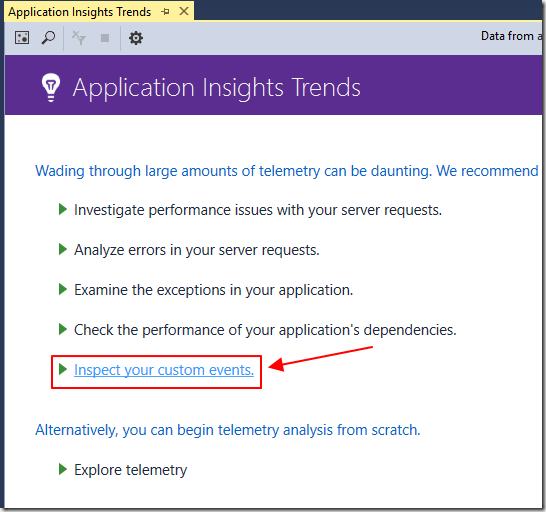
…you can then select Inspect your custom events.
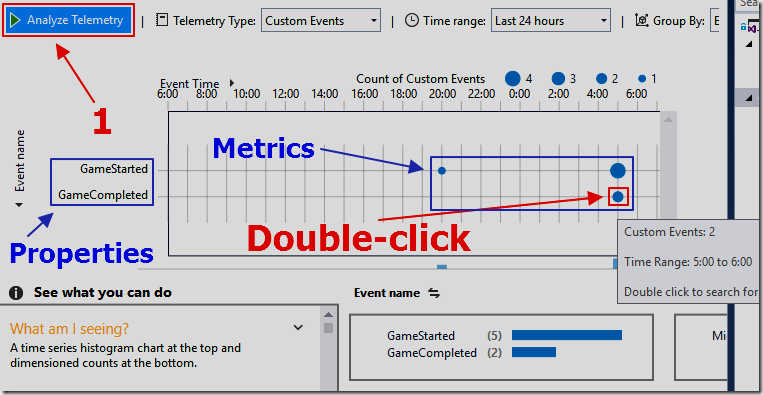
Click the Analyze Telemetry button to process the latest data. You will see where the Properties and Metrics have been tracked.
Note: It will take a few minutes for your custom events to show.
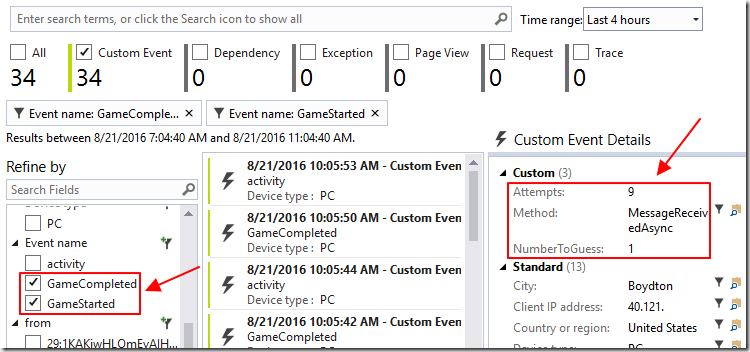
You can double-click on a trend to drill into the data.
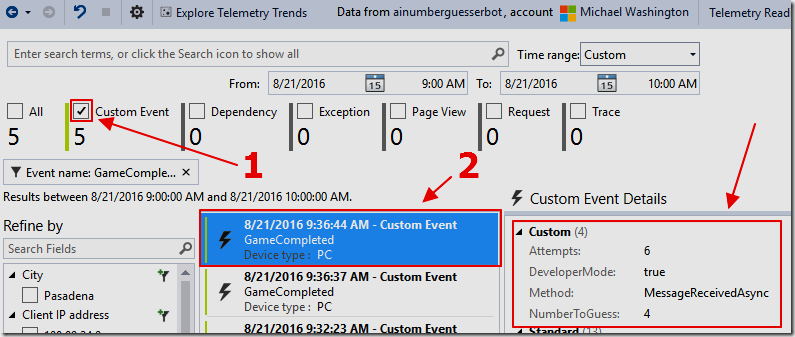
This will take you to the search screen where you can filter further and view the details of each individual event.
Application Insights Portal
You can access the Application Insights Portal on the Microsoft Azure site by selecting it from the menu in Visual Studio.
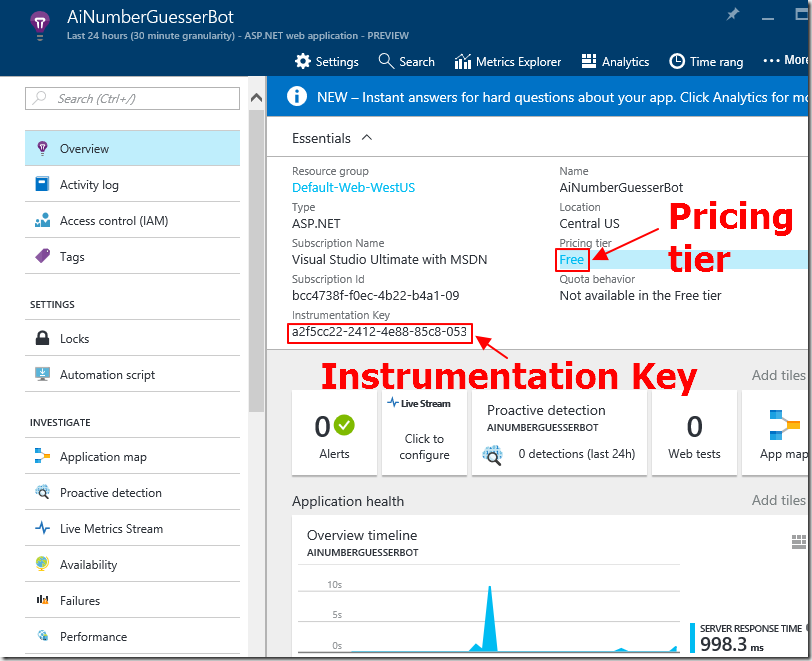
It is there that you can see and change your Pricing tier.
You can also obtain your Instrumentation Key.
Monitoring A Published Application
You can monitor your published Bot.
See the following article for instructions on publishing the Bot: Creating a Skype Bot Using The Microsoft Bot Framework.
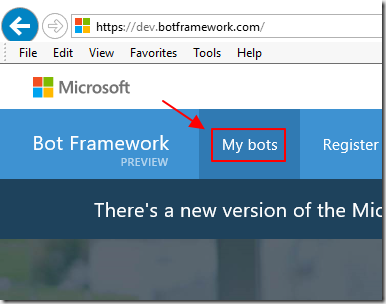
After your Bot is published, on the https://dev.botframework.com/ site, select My bots.
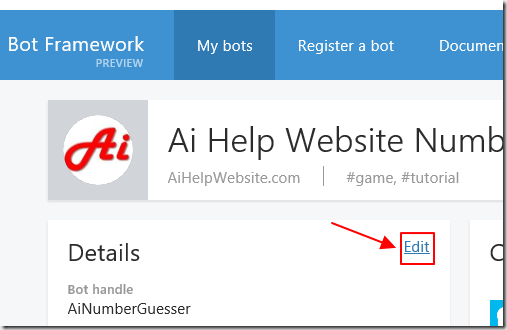
Edit the Bot configuration.
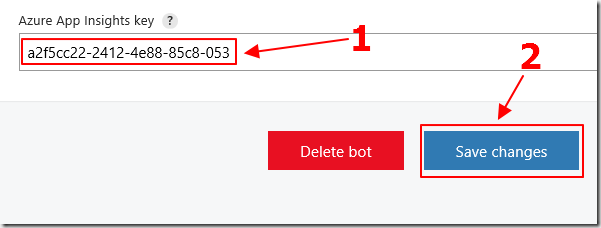
Enter the Instrumentation Key (from the Microsoft Azure site), and click Save changes.
This will enable additional properties and metrics to track.
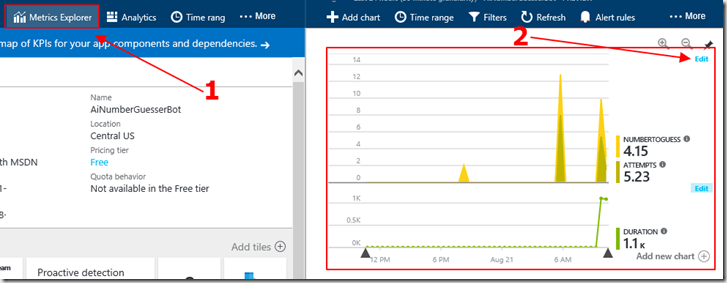
Return to the Application Insights resource on the Microsoft Azure site.
You can now monitor your published application and create custom charts using default tracking data and your custom properties and metrics.
Links – Application Insights
Application Insights - introduction
Application Insights API for custom events and metrics
Get started with Visual Studio Application Insights
Set up Application Insights for ASP.NET
Learn more about Application Insights tools in Visual Studio
Links - Bot Framework
Creating a Hello World! Bot Using The Microsoft Bot Framework
Introduction To Using Dialogs With The Microsoft Bot Framework
Creating a Skype Bot Using The Microsoft Bot Framework
Creating A Facebook Bot Using Microsoft Bot Framework
Download
You can download the code from the Download page