
3/6/2017 Webmaster
An End-To-End Azure Machine Learning Studio Application
The Microsoft Azure Machine Learning Studio allows you to create complete application solutions that employ predictive analytics.
The resulting applications allow you to use data to make forecasts and predictions that drive intelligent business decisions.
In the following series of articles we will create an Azure Machine Learning experiment that predicts the price of a vehicle given parameters such as make, horsepower, and body style. It does that by creating a Model based on prices of previous vehicles. We will then operationalize the model by creating a web service. We will then create an Angular 2+ application that consumes the web service. Finally we will create a programmatic method to update the model with new data gathered from our Angular 2+ application.
The series of articles are as follows:
- (this article) An End-To-End Azure Machine Learning Studio Application – Create an Azure Machine Learning experiment and operationalize it by creating a web service and consuming it using Microsoft Excel.
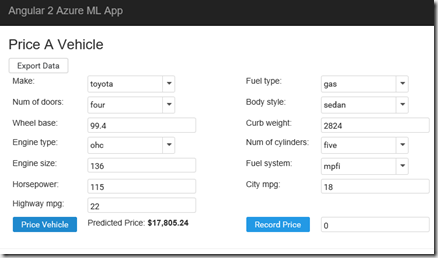
- An Angular 2+ Application Consuming an Azure Machine Learning Model – Create an Angular 2+ application that consumes a web service created from an Azure Machine Learning experiment.
- Retraining an Azure Machine Learning Application – This article covers the steps needed to update the Azure Machine Learning model with new data to improve its predictions.
Create an Azure Machine Learning Workspace
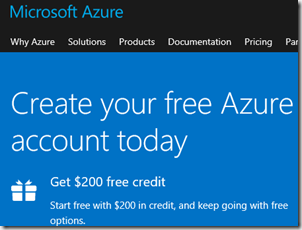
If you do not already have an Azure Subscription go to: https://azure.microsoft.com/en-us/free/ to create one.
Note: There is a free option to use Azure Machine Learning (simply sign-in on this page). However, we will cover using the the Standard version that requires a Free Azure Subscription. However, as you can see on the pricing page, if you do not use the Azure Machine learning too much you will not occur any significant charges. Following this demo should occur about $4 in web service charges.
Create An Azure Machine Learning Workspace
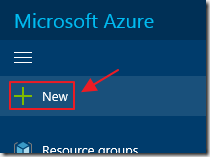
Log into the Azure Portal (at: https://portal.azure.com/) and Click the New button.
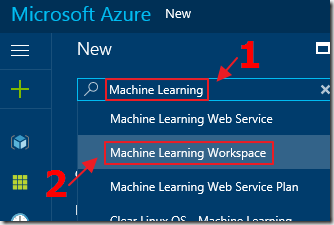
Search for Machine Learning Workspace and select it.
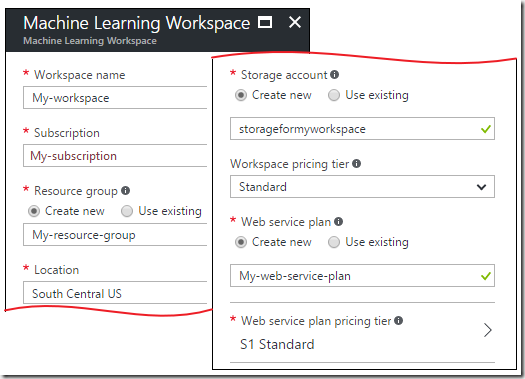
You will be guided through the wizard to create your workspace. See: Create an Azure Machine Learning workspace for documentation on the options.
Note, at this time I have had problems creating retraining web services (covered in the third tutorial of this series) when using any location other than South Central US.
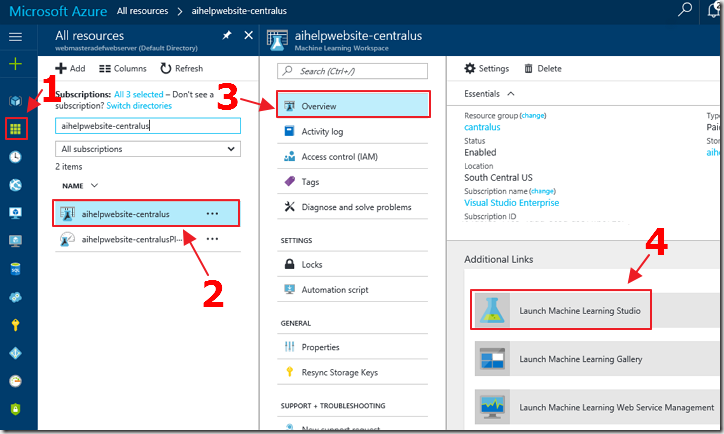
After your workspace is created, select the green All Resources icon, search for your Azure Machine Learning Workspace and select it.
Select Overview then Launch Machine Learning Studio.
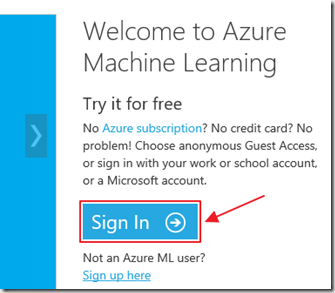
You will be taken to https://studio.azureml.net and asked to log in using your Azure username and password.
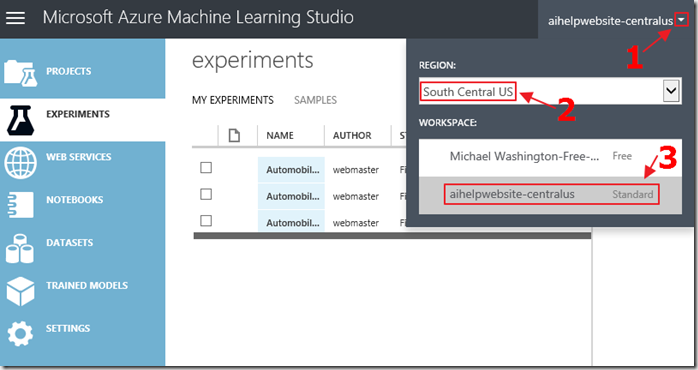
When the Azure Machine Learning Studio opens, ensure that you select the Region that you created the Workspace in and the correct Workspace.
Create An Experiment
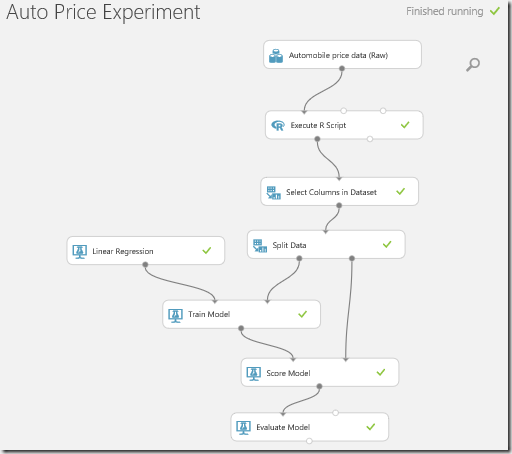
We will now create the Auto Price Experiment.
This will allow us to create a Model, evaluate it, and then operationalize it.
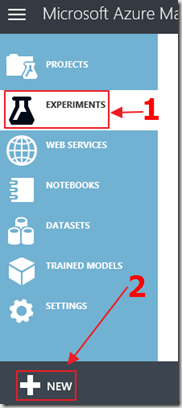
Click the New button.
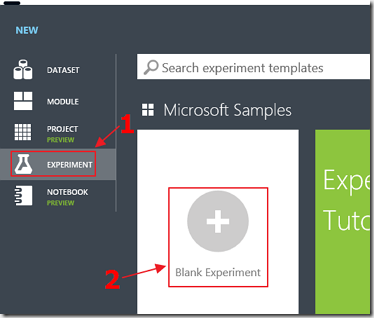
Select Experiment then Blank Experiment.
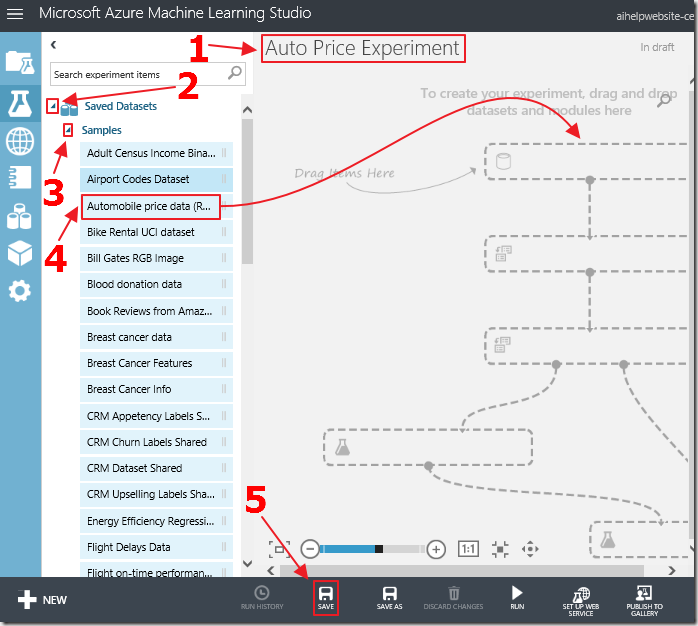
Click on the title to edit it and rename it Auto Price Experiment.
Expand the Saved Datasets node and drag and drop the Automobile price data (RAW) dataset to the design surface (on the right-side of the window).
Click the Save button (you should click the Save button this regularly).
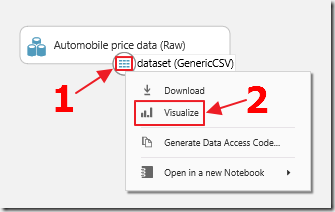
Right-click on the circle on the bottom of the Automobile price data (RAW) dataset and select Visualize.
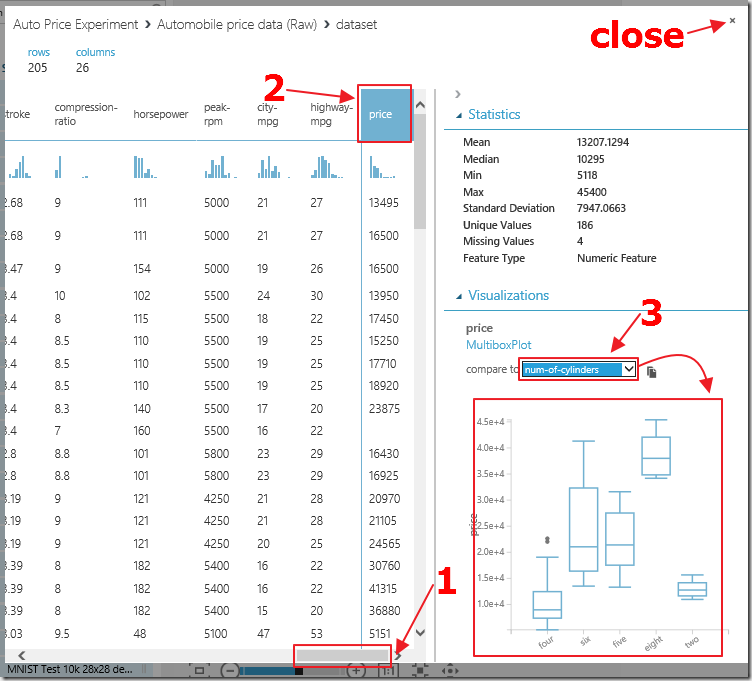
Examine the data.
For example, if you click on the price column and then select num-of-cylinders in the compare to box, you will see a display showing you that there is a relationship between the two that should help in building a Model that can make predictions.
Note that there are currently 205 rows of data (see the upper left-hand corner of the window).
When you have completed the examination of the data, click the close button.
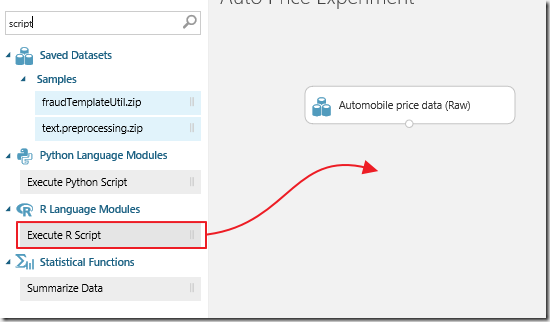
We will now demonstrate how to use a R Script to modify or filter data.
Search for, and drag and drop an R Script module on the design surface.
Connect the Automobile price data (RAW) dataset to the Execute R Script module by first clicking in the circle on the Automobile price data (RAW) dataset, and holding the mouse button down as you drag to the left circle on top of the Execute R Script module. Then let the mouse button go.
You may have to try a few times until you get the hang of it.
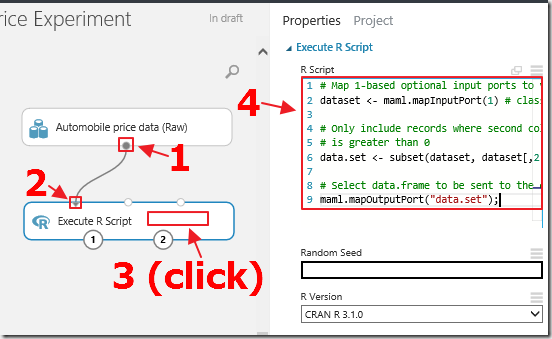
Click on the Execute R Script module to select it.
Paste the following script in the R Script box:
# Map 1-based optional input ports to variables
dataset <- maml.mapInputPort(1) # class: data.frame
# Only include records where second column (normalized-losses)
# is greater than 0
data.set <- subset(dataset, dataset[,2] > 0)
# Select data.frame to be sent to the output Dataset port
maml.mapOutputPort("data.set");
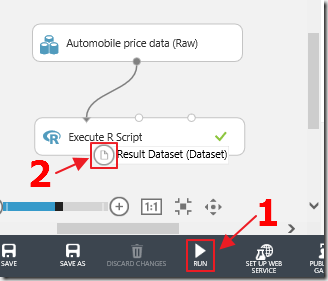
Click the Run button to populate data from the Automobile price data (RAW) dataset to the Execute R Script module.
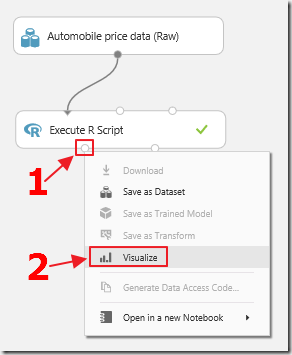
After the data has been populated (you will know because you will see a green checkbox on the Execute R Script module), right-click on the bottom left-hand circle on the Execute R Script module and select Visualize.
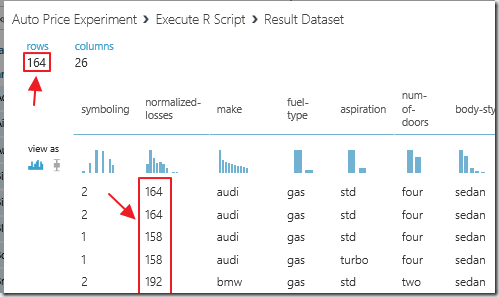
Note that there are now only 164 rows and all the rows of normalized-losses is greater than 0.
Select Columns
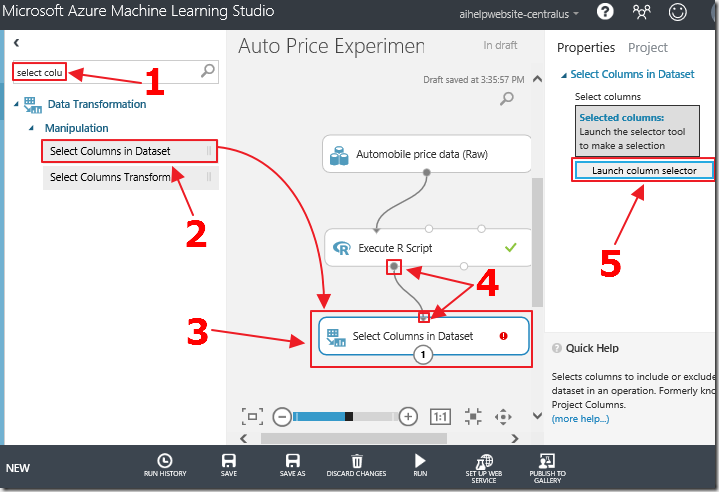
We only want to include the columns that will benefit the Model.
Search for the Select Columns in Dataset module and drag it on the design surface.
Connect it to the Execute R Script module.
While the Select Columns in Dataset module is selected, click the Launch column selector button.
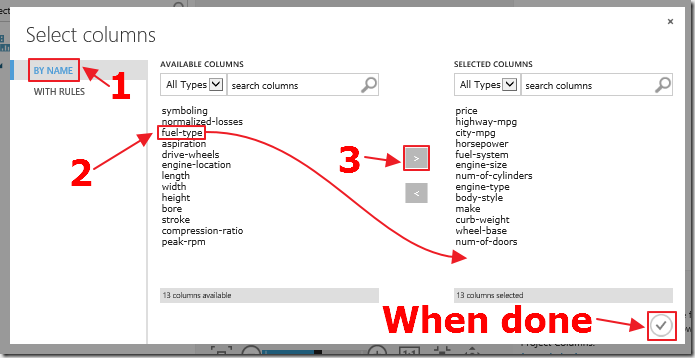
Select each column from Available Columns and move it to the Selected Columns section by clicking the right pointing arrow button (after selecting each column).
Add the following columns:
- price
- highway-mpg
- city-mpg
- horsepower
- fuel-system
- engine-size
- num-of-cylinders
- engine-type
- body-style
- make
- curb-weight
- wheel-base
- num-of-doors
- fuel-type
Click the check box in the lower right-hand corner when done to close the window.
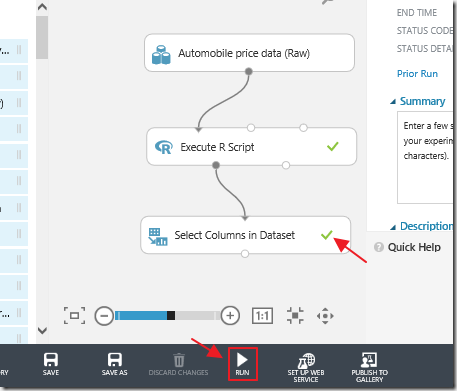
Click the Run button to populate the data into the Select Columns in Dataset module.
A green check will appear in the module when it is complete.
Split Data
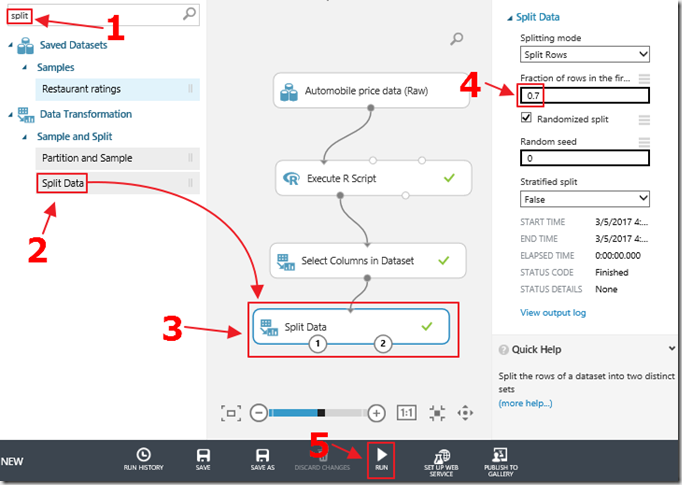
Before we can train the Model, we need to randomly split the data.
Part of the data will be used for training the Model, and the other held back data will be used to validate the Model.
Drag and drop a Split Data module to the design surface and connect it to the Select Columns in Dataset module.
While the Select Columns in Dataset module is selected, set the Fraction of rows in the first output dataset to 0.7 (to indicate that 70% of the data will be used to train the Model).
Click Run to populate the data to the module.
Train The Model
We now need to pick a Model to train.
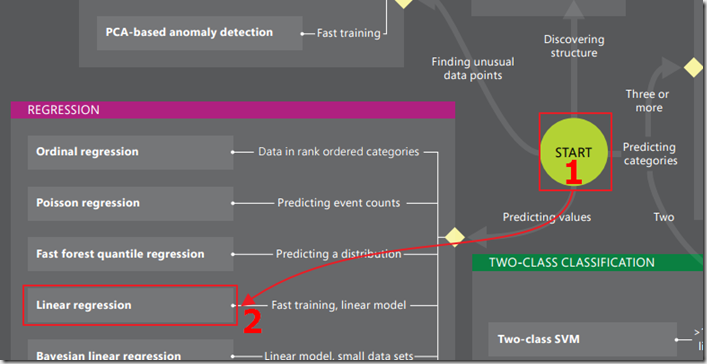
Consult Machine learning algorithm cheat sheet and How to choose algorithms for Microsoft Azure Machine Learning to determine a Model. Doing this, we decide to train a Linear regression Model.
Note, we would normally try different Models and different settings to determine the best one to use.
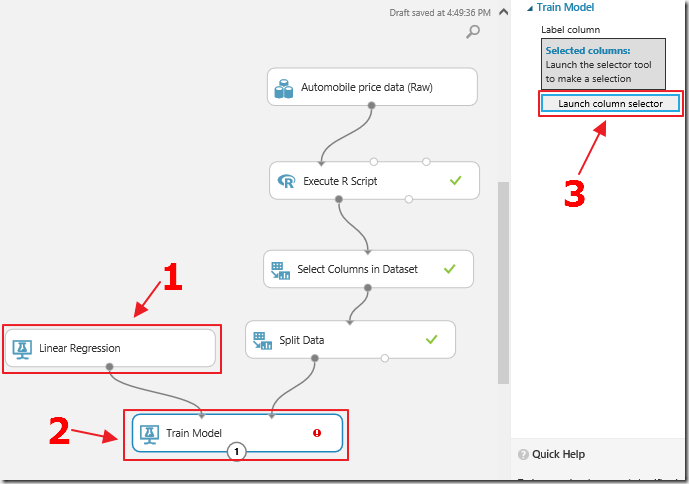
Drag and drop a Linear Regression module and a Train Model module on the design surface, and connect them together along with the Split Data module.
While the Train Model module is selected, click the Launch column selector button.
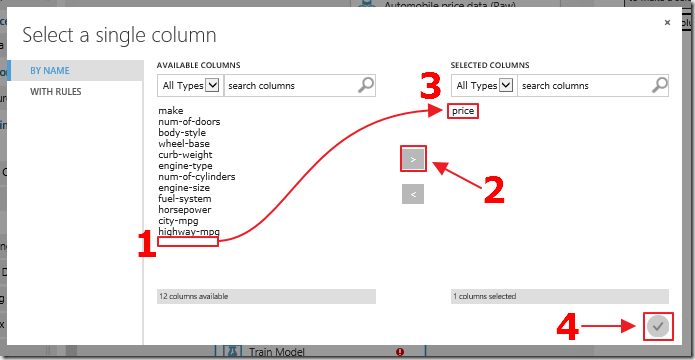
Select the price column, because it is the column that we want the Model to predict.
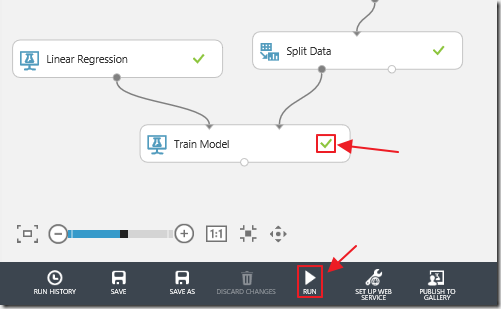
Click Run to populate the data to the Train Model module.
Score The Model

We now need to score the Model against the data held back with the Split Data module.
Drag and drop a Score Model module on the design surface, and connect it to the Train Model module and the Split Data module.
Click Run to populate the data to the Score Model module.
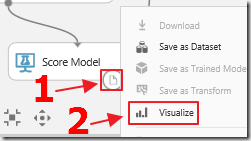
Visualize the Score Model results.
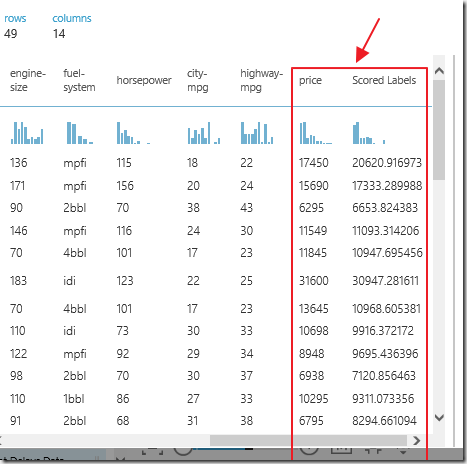
When we look at the last two columns, we can see the actual price, and the price that the Model predicted in the Scored Labels column.
Evaluate The Model
We now need to evaluate the performance of the Model.
Drag and drop an Evaluate Model module on the design surface, and connect it to the Score Model module.
Click Run to populate the data to the Evaluate Model module.
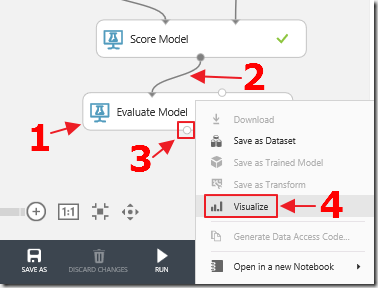
Right-click on the bottom left-hand circle on the Evaluate Model module and select Visualize.
To fully understand the results of a evaluation see: How to evaluate model performance in Azure Machine Learning.
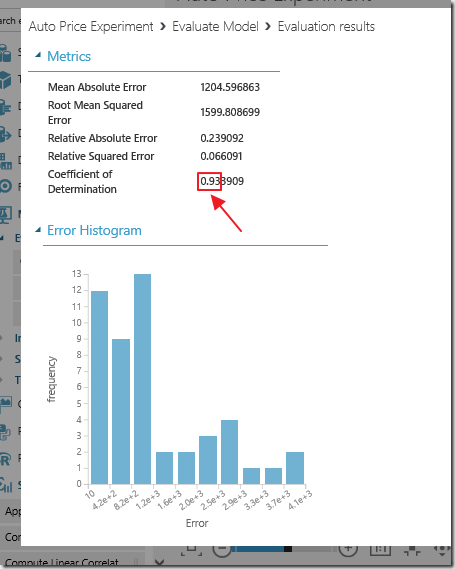
For a Linear Regression, a Coefficient of Determination of 0.93 (1.0 is the highest possible value) is considered excellent.
Save the experiment.
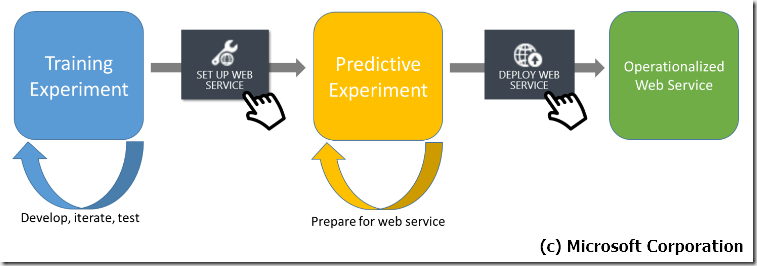
Create A Predictive Web Service
Now that we have a Model, we need to operationalize it (turn it into something that we can consume).
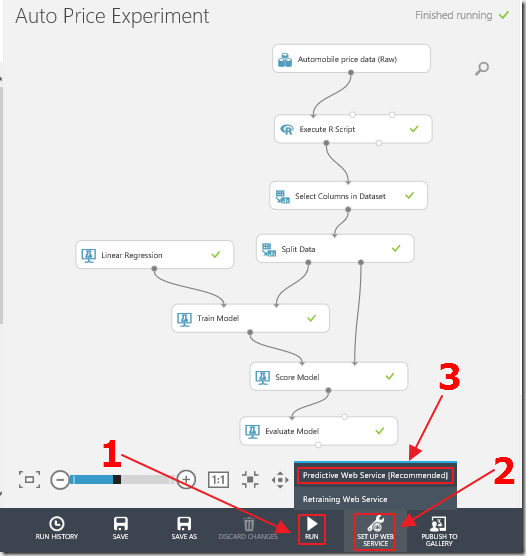
Click Run to run the entire experiment (you must do this step or the option to create a Predictive Web Service will not be available).
Click the Set Up Web Service button and select Predictive Web Service.
The Predictive Experiment will be created.
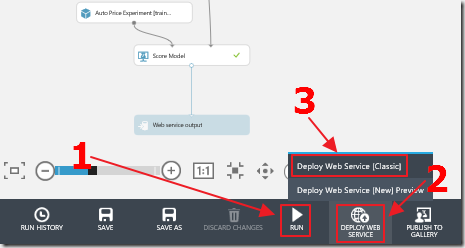
Click the Run button to run and validate the Predictive Experiment.
Click the Deploy Web Service button and select Deploy Web Service [Classic].
Consume The Model Using Excel
We now have a web service that can be consumed programmatically.
However, it helps to enable the sample data option when consuming the web service in Microsoft Excel.
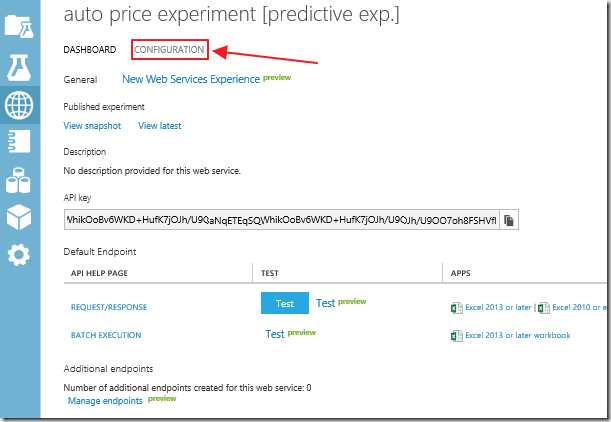
Click the Configuration button.
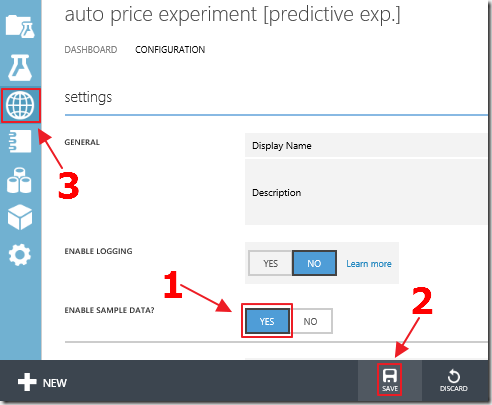
Click the Yes button next to Enable Sample Data and then click the Save button.
Click the world icon to navigate to the menu that will show all your web services.
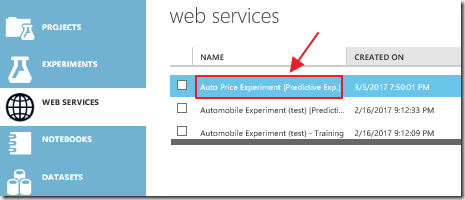
This is the menu that allows you to return to your web services at any time.
In the list of web services, click on the web service your were working on to return to its configuration.
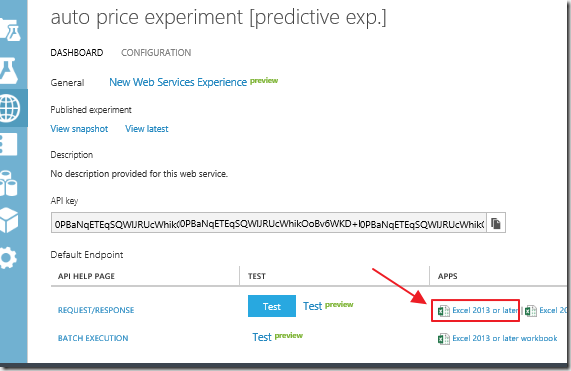
Click on the Excel 2013 or later link on the Request/Response row.
Save the Excel file that will pop up, and and open it in Microsoft Excel.
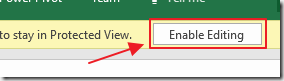
When you open the file in Microsoft Excel, you will have to Enable Editing.
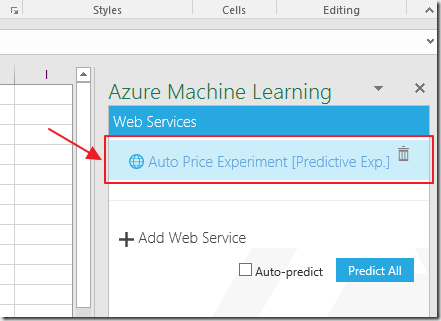
The Machine Learning plug-in will display.
Click the button that has the name of the experiment to enable it.
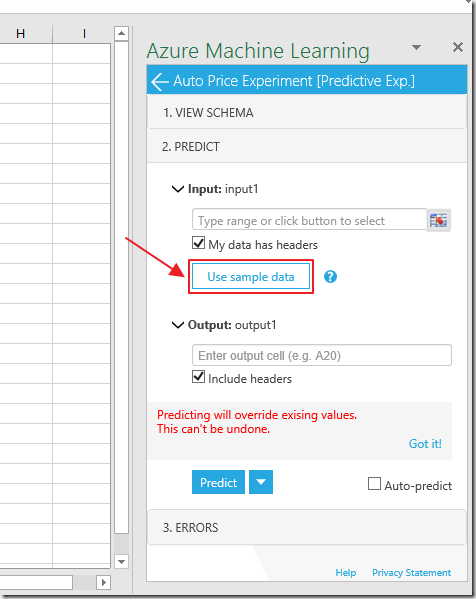
Click the Use sample data button.
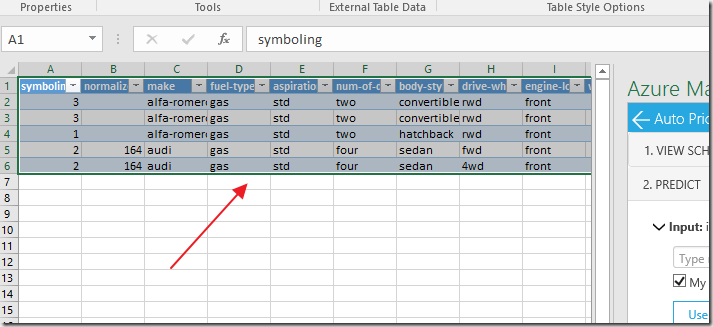
Sample data will display.
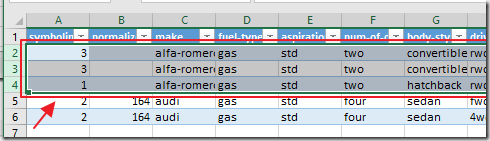
Highlight and delete any rows that do not have data for all columns. Otherwise this will cause an error.
The web service expects a value for all fields even if they are not all used by the final Model.
Note, It is possible to alter the predictive web service, by adding a Select Columns in Dataset module, to only require values that are used by the Model.
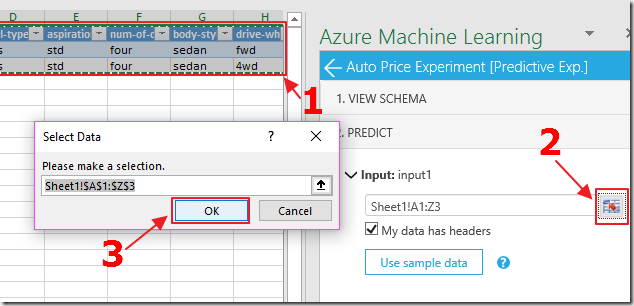
Highlight the remaining sample data, Click the cell selection button next to Input, the cells should now be selected in the Select Data popup.
Click the Ok button.
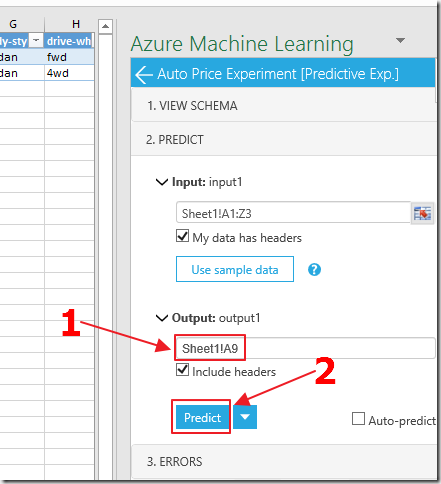
Enter a cell for an open row on the Excel sheet under Output and click the Predict button.
The web service, in Azure, will be called, and passed the sample values to the Model.
The Model will return the predicted value for the price.
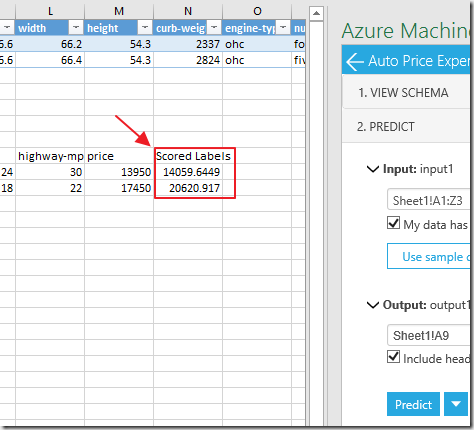
The Scored Labels section will contain the price predicted by the Model.
Links
- What is Machine Learning Studio?
- Create an Azure Machine Learning workspace
- Machine Learning Guide
- Machine learning algorithm cheat sheet and How to choose algorithms for Microsoft Azure Machine Learning
- How to evaluate model performance in Azure Machine Learning
- Machine Learning Studio: Algorithm and Module Help
- Walkthrough: Develop a predictive analytics solution for credit risk assessment in Azure Machine Learning